Performance
Amount in lakhs
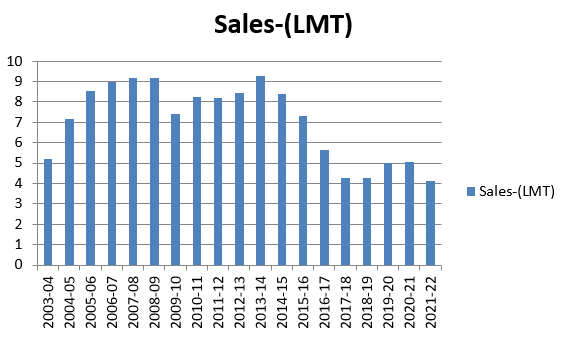
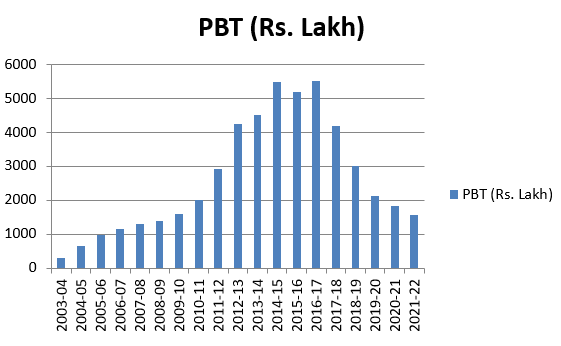
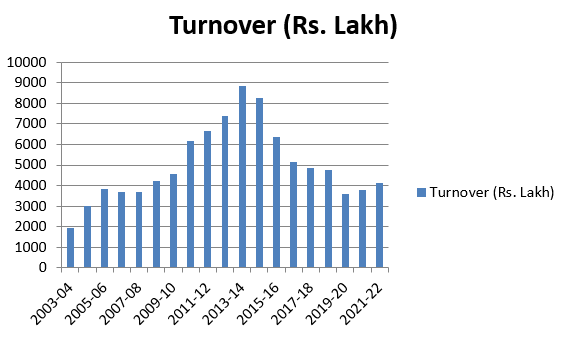
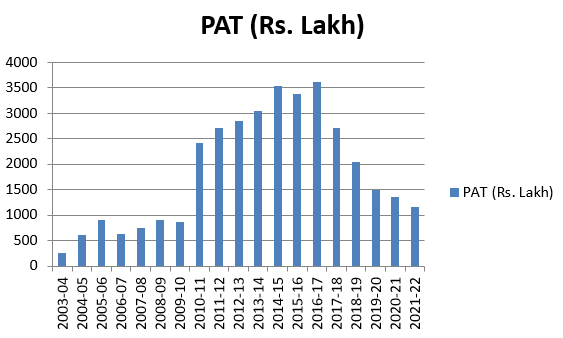
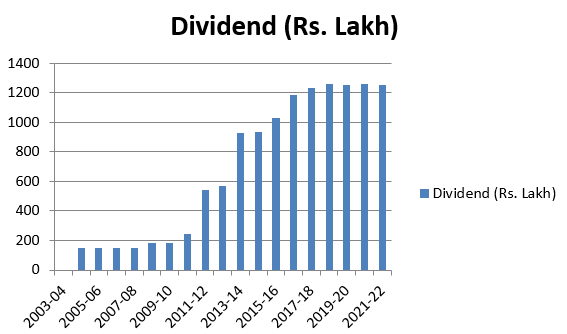
| Year | Sales-(LMT) | Turnover | PBT | PAT | Dividend |
| 2003-04 | 5.22 | 1940.39 | 283.04 | 261.28 | — |
| 2004-05 | 7.16 | 2993.61 | 656.81 | 605.31 | 146.60 |
| 2005-06 | 8.54 | 3844.75 | 985.35 | 899.88 | 146.60 |
| 2006-07 | 8.96 | 3706.66 | 1152.61 | 632.85 | 146.60 |
| 2007-08 | 9.18 | 3680.61 | 1293.63 | 753.56 | 150.72 |
| 2008-09 | 9.16 | 447.32 | 1396.20 | 903.55 | 181.00 |
| 2009-10 | 7.43 | 4560.98 | 1587.54 | 867.30 | 183.25 |
| 2010-11 | 8.24 | 6148.41 | 1989.41 | 2405.06 | 245.54 |
| 2011-12 | 8.19 | 6653.01 | 2906.85 | 2707.39 | 542.41 |
| 2012-13 | 8.42 | 7383.99 | 4227.44 | 2848.70 | 571.72 |
| 2013-14 | 9.29 | 8859.27 | 4499.29 | 3045.99 | 930.88 |
| 2014-15 | 8.37 | 8243.63 | 5481.73 | 3536.73 | 934.55 |
| 2015-16 | 7.30 | 6380.23 | 5183.18 | 3378.67 | 1026.17 |
| 2016-17 | 5.63 | 5133.23 | 5519.02 | 3603.38 | 1187.43 |
| 2017-18 | 4.29 | 4860.06 | 4187.64 | 2703.49 | 1230.00 |
| 2018-19 | 4.27 | 4745.63 | 2989.38 | 2048.78 | 1260.00 |
| 2019-20 | 4.99 | 3586.82 | 2106.07 | 1491.48 | 1251.00 |
| 2020-21 | 5.05 | 3781.35 | 1821.94 | 1348.11 | 1260.00 |
| 2021-22 | 4.13 | 4143.70 | 1557.29 | 1159.33 | 1255.00 |
| 2022-23 | 4.41 | 5603.97 | 1346.16 | 973.69 | 293.00 |
| 2023-24 | 3.22 | 3048.09 | 1537.51 | 1117.71 | 1284.00 |
| 2024-25 | 3.08 | 2611.55 | 1310.16 | 978.70 | 900.00 |
Performance Ghraphs
")

")


PERFORMANCE OF THE COMPANY
The Company’s growth was exceptional during last 21 years of operation. It started with a paid up capital of Rs.7.33. The Shareholders fund as on 31.03.2024 is Rs.256.62 crore. Thus, it has recorded an impressive growth of 3400 % over a period of 21 years. During the year 2023-24, the company achieved a turnover of Rs.30.48 Crore in comparison to a turnover of Rs.19.40 crores in the year 2003-04 and earned a profit before tax of Rs.15.38 crore in comparison to Rs.2.83 crore in the year 2003-04.
The Performance of the Company during the last 11 years is furnished hereunder.
Amount/Crores
| Year | Sales-(LMT) | Turnover | Net worth | Reserves | Cash & Bank Balance | PBT | Dividend |
| 2011-12 | 8.18 | 66.53 | 109.27 | 101.94 | 119.71 | 29.05 | 5.42 |
| 2012-13 | 8.42 | 73.83 | 131.07 | 123.74 | 155.59 | 38.50 | 5.71 |
| 2013-14 | 9.29 | 88.59 | 150.64 | 143.31 | 169.87 | 52.10 | 9.30 |
| 2014-15 | 8.37 | 82.43 | 174.79 | 167.46 | 187.42 | 54.72 | 9.34 |
| 2015-16 | 7.30 | 63.80 | 196.64 | 189.31 | 199.36 | 44.32 | 10.26 |
| 2016-17 | 5.64 | 51.33 | 218.38 | 211.05 | 209.49 | 36.24 | 11.87 |
| 2017-18 | 4.29 | 48.60 | 245.42 | 215.42 | 208.36 | 31.58 | 12.30 |
| 2018-19 | 4.27 | 47.46 | 251.07 | 221.07 | 221.24 | 29.89 | 12.60 |
| 2019-20 | 4.99 | 35.87 | 250.20 | 220.20 | 222.96 | 21.06 | 12.51 |
| 2020-21 | 5.05 | 37.81 | 251.61 | 201.61 | 156.89 | 18.22 | 12.60 |
| 2021-22 | 4.13 | 41.44 | 250.82 | 200.82 | 42.34 | 15.57 | 12.55 |
| 2022-23 | 4.41 | 56.04 | 248.19 | 198.19 | 118.14 | 13.46 | 2.93 |
| 2023-24 | 3.22 | 30.48 | 256.62 | 206.62 | 130.42 | 15.38 | 12.84 |
| 2024-25 | 3.08 | 26.11 | 253.67 | 203.67 | 163.35 | 13.10 | 9.00 |
*******